Open up the service console on your ESX host and run the esxtop command. You may already know that while in esxtop, interactively pressing the c, m, d, and n keys changes the esxtop focus to each of the four food groups: CPU, Memory, Disk, and Network respectively, but did you know there are more advanced views for drilling down to more detailed information?
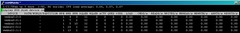
For example, we already know pressing the d key provides disk information from the adapter level which contains rolled up statistics from all current activity on the adapter:
Now try these interactive keys:
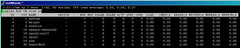
Press the u key to view disk information from the device level – this shows us statistics for each LUN per adapter:

Press the v key to view disk information from the VM level – the most granular level esxtop provides:
There’s also a key, when looking at CPU statistics, which will expand a VM showing the individual processes that make up that running VM. Can you find it? This will come in handy if you ever find yourself in the situation where you need to kill a VM from the service console.
If you would like to view the complete documentation for esxtop (known as man pages in the *nix world), use the command man esxtop in the service console.
ESXTOP is powerful tool whos capabilities extend quite a bit farther than what I’ve briefly talked about here. I hope to see it in future versions of ESX (and ESXi).


This is also a great document about ESXTOP: http://communities.vmware.com/docs/DOC-9279
Jason,
ESXTOP is a great tool. For the example of using it to collect disk stats check out my post http://vmetc.com/2008/06/25/how-to-get-esx-host-and-vm-disk-io-stats/