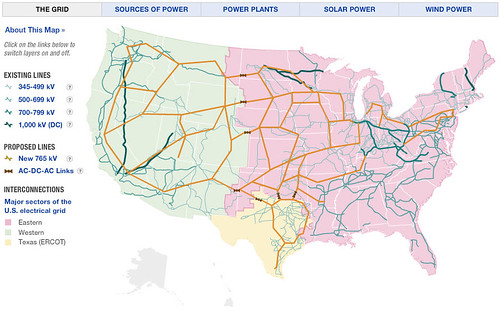
I picked up this interesting map off Christopher Crowhurst’s blog. It’s a visualization of the United States power grid. The source comes from NPR’s article “Visualizing The Grid“. Follow the link to NPR and click on the various tabs at the top to see power plant, solar power, and wind power sources across the United States.
How much power are you saving due to virtualization? Don’t forget virtualization cuts power consumption in more ways than just one. The most obvious would be the reduction in server hardware count in the datacenter. There are other indirect power savings vectors such as reduction in cooling, reduction in network and SAN switches due to server consolidation, less UPS utilization, and maybe even a reduction in datacenter size which in and of itself presents more indirect savings: security, plumbing, utility lighting, cleaning, maintenance, real estate, etc.