Configure VMware ESX(i) Round Robin on EMC Storage

February 4th, 2010 by jason No comments »

I recently set out to enable VMware ESX(i) 4 Round Robin load balancing with EMC Celerra (CLARiiON) fibre channel storage.  Before I get to the details of how I did it, let me preface this discussion with a bit about how I interpret Celerra storage architecture. 

The Celerra is built on CLARiiON fibre channel storage and as such, it leverages the benefits and successes CLARiiON has built over the years.  I believe most CLARiiON’s are, by default, active/passive arrays from VMware’s perspective.  Maybe more accurately stated, all controllers are active, however, each controller has sole ownership of a LUN or set of LUNs.  If a host wants access to a LUN, it is preferable to go through the owning controller (the preferred path).  Attempts to access a LUN through any other controller than the owning controller will result in a “Trespass” in EMC speak.  A Trespass is shift in LUN ownership from one controller to another in order to service an I/O request from a fabric host.  When I first saw Trespasses in Navisphere, I was alarmed.  I soon learned that they aren’t all that bad in moderation.  EMC reports that a Trespass occurs EXTREMELY quickly and in almost all cases will not cause problems.  However, as with any array which adopts the LUN ownership model, stacking up enough I/O requests which force a race condition between controllers for LUN access, will cause a condition known as thrashing.   Thrashing causes storage latency and queuing as controllers play tug of war for LUN access.  This is why it is important for ESX hosts, which share LUN access, to consistently access LUNs via the same controller path.  

As I said, the LUN ownership model above is the “out-of-box” configuration for the Celerra, also known as Failover Mode 1 in EMC Navisphere.  The LUN path going through the owning controller will be the Active path from a VMware perspective.  Other paths will be Standby.  This is true for both MRU and Fixed path selection policies.  What I needed to know was how to enable Round Robin path selection in VMware.  Choosing Round Robin in the vSphere Client is easy enough, however, there’s more to it than that because the Celerra is still operating in Failover Mode 1 where I/O can only go through the owning controller. 

So the first step in this process is to read the CLARiiON/VMware Applied Technology Guide which says I need to change the Failover Mode of the Celerra from 1 to 4 using Navisphere (FLARE release 28 version 04.28.000.5.704 or later may be required).  A value of 4 tells the CLARiiON to switch to the ALUA (Asymmetric Logical Unit Access or Active/Active) mode.  In this mode, the controller/LUN ownership model still exists, however, instead of transferring ownership of the LUN to the other controller with a Trespass, LUN access is allowed through the non-owning controller.  The I/O is passed by the non-owning controller to the owning controller via the backplane and then to the LUN.  In this configuration, both controllers are Active and can be used to access a LUN without causing ownership contention or thrashing.  It’s worth mentioning right now that although both controllers are active, the Celerra will report to ESX the owning controller as the optimal path, and the non-owning controller as the non-optimal path.  This information will be key a little later on.  Each ESX host needs to be configured for Failover Mode 4 in Navisphere.  The easiest way to do this is to run the Failover Setup Wizard.  Repeat the process for each ESX host.  One problem I ran into here is that after making the configuration change, each host and HBA still showed a Failover Mode of 1 in the Navisphere GUI.  It was as if the Failover Setup Wizard steps were not persisting.  I failed to accept this so I installed the Navisphere CLI and verified each host with the following command: 

naviseccli -h <SPA_IP_ADDRESS> port -list –all

Output showed that Failover Mode 4 was configured:

Information about each HBA:
HBA UID:                 20:00:00:00:C9:8F:C8:C4:10:00:00:00:C9:8F:C8:C4
Server Name:             lando.boche.mcse
Server IP Address:       192.168.110.5
HBA Model Description:
HBA Vendor Description:  VMware ESX 4.0.0
HBA Device Driver Name:
Information about each port of this HBA:�
    SP Name:               SP A
    SP Port ID:            2
    HBA Devicename:        naa.50060160c4602f4a50060160c4602f4a
    Trusted:               NO
    Logged In:             YES
    Source ID:             66560
    Defined:               YES
    Initiator Type:           3
    StorageGroup Name:     DL385_G2
    ArrayCommPath:         1
    Failover mode:         4
    Unit serial number:    Array

Unfortunately, the CLARiiON/VMware Applied Technology Guide didn’t give me the remaining information I needed to actually get ALUA and Round Robin working.  So I turned to social networking and my circle of VMware and EMC storage experts on Twitter.  They put me on to the fact that I needed to configure SATP for VMW_SATP_ALUA_CX, something I wasn’t familiar with yet. 

So the next step is a multistep procedure to configure the Pluggable Storage Architecture on the ESX hosts.  More specifically, SATP (Storage Array Type Plugin) and the PSP (Path Selection Plugin), in that order. Duncan Epping provides a good foundation for PSA which can be learned here.

Configuring the SATP tells the PSA what type of array we’re using, and more accurately, what failover mode the array is running.  In this case, I needed to configure the SATP for each LUN to VMW_SATP_ALUA_CX which is the EMC CLARiiON (CX series) running in ALUA mode (active/active failover mode 4).  The command to do this must be issued on each ESX host in the cluster for each active/active LUN and is as follows: 

#set SATP
esxcli nmp satp setconfig –config VMW_SATP_ALUA_CX –device naa.50060160c4602f4a50060160c4602f4a
esxcli nmp satp setconfig –config VMW_SATP_ALUA_CX –device naa.60060160ec242700be1a7ec7a208df11
esxcli nmp satp setconfig –config VMW_SATP_ALUA_CX –device naa.60060160ec242700bf1a7ec7a208df11
esxcli nmp satp setconfig –config VMW_SATP_ALUA_CX –device naa.60060160ec2427001cac9740a308df11
esxcli nmp satp setconfig –config VMW_SATP_ALUA_CX –device naa.60060160ec2427001dac9740a308df11

The devices you see above can be found in the vSphere Client when looking at the HBA devices discovered.  You can also find devices with the following command on the ESX Service Console: 

esxcli nmp device list 

I found that changing the SATP requires a host reboot for the change to take effect (thank you Scott Lowe).  After the host is rebooted, the same command used above should reflect that the SATP has been set correctly: 

esxcli nmp device list 

Results in: 

naa.60060160ec2427001dac9740a308df11
    Device Display Name: DGC Fibre Channel Disk (naa.60060160ec2427001dac9740a308df11)
    Storage Array Type: VMW_SATP_ALUA_CX
    Storage Array Type Device Config: {navireg=on, ipfilter=on}{implicit_support=on;explicit_ow=on;alua_followover=on;{TPG_id=1,TPG_state=ANO}{TPG_id=2,TPG_state=AO}}
    Path Selection Policy: VMW_PSP_FIXED
    Path Selection Policy Device Config: {policy=rr,iops=1000,bytes=10485760,useANO=0;lastPat=0,numBytesPending=0}
    Working Paths: vmhba1:C0:T0:L61 

Once the SATP is set, it is time to configure the PSP for each LUN to Round Robin.  You can do this via the vSphere Client, or you can issue the commands at the Service Console: 

#set PSP per device
esxcli nmp psp setconfig –config VMW_PSP_RR –device naa.60060160ec242700be1a7ec7a208df11
esxcli nmp psp setconfig –config VMW_PSP_RR –device naa.60060160ec242700bf1a7ec7a208df11
esxcli nmp psp setconfig –config VMW_PSP_RR –device naa.60060160ec2427001cac9740a308df11
esxcli nmp psp setconfig –config VMW_PSP_RR –device naa.60060160ec2427001dac9740a308df11 

#set PSP for device
esxcli nmp device setpolicy –psp VMW_PSP_RR –device naa.50060160c4602f4a50060160c4602f4a
esxcli nmp device setpolicy –psp VMW_PSP_RR –device naa.60060160ec242700be1a7ec7a208df11
esxcli nmp device setpolicy –psp VMW_PSP_RR –device naa.60060160ec242700bf1a7ec7a208df11
esxcli nmp device setpolicy –psp VMW_PSP_RR –device naa.60060160ec2427001cac9740a308df11
esxcli nmp device setpolicy –psp VMW_PSP_RR –device naa.60060160ec2427001dac9740a308df11 

Once again, running the command: 

esxcli nmp device list 

Now results in: 

naa.60060160ec2427001dac9740a308df11
    Device Display Name: DGC Fibre Channel Disk (naa.60060160ec2427001dac9740a308df11)
    Storage Array Type: VMW_SATP_ALUA_CX
    Storage Array Type Device Config: {navireg=on, ipfilter=on}{implicit_support=on;explicit_ow=on;alua_followover=on;{TPG_id=1,TPG_state=ANO}{TPG_id=2,TPG_state=AO}}
    Path Selection Policy: VMW_PSP_RR
    Path Selection Policy Device Config: {policy=rr,iops=1000,bytes=10485760,useANO=0;lastPat=0,numBytesPending=0}
    Working Paths: vmhba1:C0:T0:L61 

Notice the Path Selection Policy has now changed to Round Robin. 

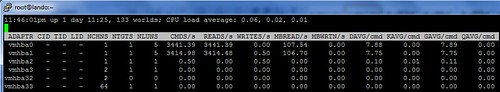
I’m good to go, right?  Wrong.  I struggled with this last bit for a while.  Using ESXTOP and IOMETER, I could see that I/O was still only going down one path instead of two.  Then I remembered something Duncan Epping had said to me in an earlier conversation a few days ago.  He mentioned something about the array reporting optimal and non-optimal paths to the PSA.  I printed out a copy of the Storage Path and Storage Plugin Management with esxcli document from VMware and took it to lunch with me.  The answer was buried on page 88.  The nmp roundrobin setting useANO is configured by default to 0 which means unoptimized paths reported by the array will not be included in Round Robin path selection unless optimized paths become unavailable.  Remember I said early on that unoptimized and optimized paths reported by the array would be a key piece of information.  We can see this in action by looking at the device list above.  The very last line shows working paths, and only one path is listed for Round Robin use – the optimized path reported by the array.  The fix here is to issue the following command, again on each host for all LUNs in the configuration: 

#use non-optimal paths for Round Robin
esxcli nmp roundrobin setconfig –useANO 1 –device naa.50060160c4602f4a50060160c4602f4a
esxcli nmp roundrobin setconfig –useANO 1 –device naa.60060160ec242700be1a7ec7a208df11
esxcli nmp roundrobin setconfig –useANO 1 –device naa.60060160ec242700bf1a7ec7a208df11
esxcli nmp roundrobin setconfig –useANO 1 –device naa.60060160ec2427001cac9740a308df11
esxcli nmp roundrobin setconfig –useANO 1 –device naa.60060160ec2427001dac9740a308df11

Once again, running the command: 

esxcli nmp device list 

Now results in: 

naa.60060160ec2427001dac9740a308df11
    Device Display Name: DGC Fibre Channel Disk (naa.60060160ec2427001dac9740a308df11)
    Storage Array Type: VMW_SATP_ALUA_CX
    Storage Array Type Device Config: {navireg=on, ipfilter=on}{implicit_support=on;explicit_support=on;explicit_allow=on;alua_followover=on;{TPG_id=1,TPG_state=ANO}
TPG_id=2,TPG_state=AO}}
    Path Selection Policy: VMW_PSP_RR
    Path Selection Policy Device Config: {policy=rr,iops=1000,bytes=10485760,useANO=1;lastPathIndex=1: NumIOsPending=0,numBytesPending=0}
    Working Paths: vmhba0:C0:T0:L61, vmhba1:C0:T0:L61 

Notice the change in useANO which now reflects a value of 1.  In addition, I now have two Working Paths – an optimized path and an unoptimized path. 

I fired up ESXTOP and IOMETER which now showed a flurry of I/O traversing both paths.  I kid you not, it was a Clark Griswold moment when all the Christmas lights on the house finally worked.

So it took a while to figure this out but with some reading and the help of experts, I finally got it, and I was extremely jazzed.  What would have helped was if VMware’s PSA was more plug and play with various array types.  For instance, why can’t PSA recognize ALUA on the CLARiiON and automatically configure SATP for VMW_SATP_ALUA_CX?  Why is a reboot required for an SATP change?  PSA configuration in the vSphere client might have also been convenient but I recognize has diminishing returns or practical use with a large amount of hosts and/or LUNs to configure.  Scripting and CLI is the way to go for consistency and automation reasons or how about PSA configuration via Host Profiles? 

I felt a little betrayed and confused by the Navisphere GUI reflecting Failover Mode 1 after several attempts to change it to 4.  I was looking at host connectivity status. Was I looking in the wrong place? 

Lastly, end to end documentation on how to configure Round Robin would have helped a lot.  EMC got me part of the way there with the CLARiiON/VMware Applied Technology Guide document, but left me hanging, making no mention of the PSA configuration needed.  I’m getting that the end game for EMC multipathing today is PowerPath, which is fine – I’ll get to that, but I really wanted to do some testing with native Round Robin first, if for no other reason to establish a baseline to compare PowerPath to once I get there. 

Thanks again to the people I leaned on to help me through this.  It was the usual crew who can always be counted on.

Service Console Directory Listing Text Color in PuTTY

January 25th, 2010 by jason No comments »

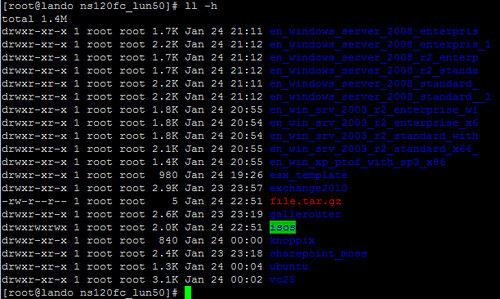
Curious about the default colors you see in a remote PuTTY session connected to the ESX Service Console?  Some are obvious such as the directory listings which show up as blue text on a black background.  Another obvious one is the compressed .tar.gz file which will show up in a nicely contrasting red text on black background.  Or how about this one which I’m sure you’ve seen, executable scripts are shown as green text on a black background.  You might be asking yourself “What about the oddball ones I see from time to time which don’t have an explanation?”  I’ve provided an example in the screenshot – a folder named isos shows up with a green background and blue text.  What does that mean? 

There’s a way to find out.  While in the remote PuTTY session connected to the ESX Service Console, run the command dircolors -p from any directory.  Here’s the default legend:

# Below are the color init strings for the basic file types. A color init
# string consists of one or more of the following numeric codes:
# Attribute codes:
# 00=none 01=bold 04=underscore 05=blink 07=reverse 08=concealed
# Text color codes:
# 30=black 31=red 32=green 33=yellow 34=blue 35=magenta 36=cyan 37=white
# Background color codes:
# 40=black 41=red 42=green 43=yellow 44=blue 45=magenta 46=cyan 47=white
NORMAL 00 # global default, although everything should be something.
FILE 00 # normal file
DIR 01;34 # directory
LINK 01;36 # symbolic link. (If you set this to ‘target’ instead of a
 # numerical value, the color is as for the file pointed to.)
FIFO 40;33 # pipe
SOCK 01;35 # socket
DOOR 01;35 # door
BLK 40;33;01 # block device driver
CHR 40;33;01 # character device driver
ORPHAN 40;31;01 # symlink to nonexistent file
SETUID 37;41 # file that is setuid (u+s)
SETGID 30;43 # file that is setgid (g+s)
STICKY_OTHER_WRITABLE 30;42 # dir that is sticky and other-writable (+t,o+w)
OTHER_WRITABLE 34;42 # dir that is other-writable (o+w) and not sticky
STICKY 37;44 # dir with the sticky bit set (+t) and not other-writable
# This is for files with execute permission:
EXEC 01;32
# List any file extensions like ‘.gz’ or ‘.tar’ that you would like ls
# to colorize below. Put the extension, a space, and the color init string.
# (and any comments you want to add after a ‘#’)
# If you use DOS-style suffixes, you may want to uncomment the following:
#.cmd 01;32 # executables (bright green)
#.exe 01;32
#.com 01;32
#.btm 01;32
#.bat 01;32
.tar 01;31 # archives or compressed (bright red)
.tgz 01;31
.arj 01;31
.taz 01;31
.lzh 01;31
.zip 01;31
.z 01;31
.Z 01;31
.gz 01;31
.bz2 01;31
.deb 01;31
.rpm 01;31
.jar 01;31
# image formats
.jpg 01;35
.jpeg 01;35
.gif 01;35
.bmp 01;35
.pbm 01;35
.pgm 01;35
.ppm 01;35
.tga 01;35
.xbm 01;35
.xpm 01;35
.tif 01;35
.tiff 01;35
.png 01;35
.mov 01;35
.mpg 01;35
.mpeg 01;35
.avi 01;35
.fli 01;35
.gl 01;35
.dl 01;35
.xcf 01;35
.xwd 01;35
# audio formats
.flac 01;35
.mp3 01;35
.mpc 01;35
.ogg 01;35
.wav 01;35


Applied to the screenshot example above, the legend tells us that the isos directory is: OTHER_WRITABLE 34;42 # dir that is other-writable (o+w) and not sticky.

Another color you may commonly see which I haven’t yet mentioned is cyan which identifies symbolic links.  These can be found in several directories.  Most often you will see symbolic links in /vmfs/volumes/ connecting a friendly datastore name with it’s not so friendly volume name which is better known by the VMkernel.

That’s it. Not what I would considering Earth shattering material here, but maybe you’ve seen these colors before and haven’t connected the dots on their meaning.  For people with Linux background, this is probably old hat.

VMTN Storage Performance Thread and the EMC Celerra NS-120

January 23rd, 2010 by jason No comments »

The VMTN Storage Performance Thread is a collaboration of storage performance results on VMware virtual infrastructure provided by VMTN Community members around the world.  The thread starts here, was locked due to length, and continues on in a new thread here.  There’s even a Google Spreadsheet version, however, activity in that data repository appears to have diminished long ago.  The spirit of the testing is outlined by thread creater and VMTN Virtuoso christianZ

“My idea is to create an open thread with uniform tests whereby the results will be all inofficial and w/o any warranty. If anybody shouldn’t be agreed with some results then he can make own tests and presents his/her results too. I hope this way to classify the different systems and give a “neutral” performance comparison. Additionally I will mention that the performance [and cost] is one of many aspects to choose the right system.” 

Testing standards are defined by christianZ so that results from each submission are consistent and comparable.  A pre-defined template is used in conjunction with IOMETER to generate the disk I/O and capture the performance metrics.  The test lab environment and the results are then appended to the thread discussion linked above.  The performance metrics measured are:

  1. Average Response Time (in Milliseconds, lower is better) – also known as latency of which VMware declares a potential problem threshold of 50ms in their Scalable Storage Performance whitepaper
  2. Average I/O per Second (number of I/Os, higher is better)
  3. Average MB per Second (in MB, higher is better)

Following are my results with the EMC Celerra NS-120 Unified Storage array

SERVER TYPE: Windows Server 2003 R2 VM ON ESXi 4.0 U1
CPU TYPE / NUMBER: VCPU / 1 / 1GB Ram (thin provisioned)
HOST TYPE: HP DL385 G2, 16GB RAM; 2x QC AMD Opteron 2356 Barcelona
STORAGE TYPE / DISK NUMBER / RAID LEVEL: EMC Celerra NS-120 / 15x 146GB 15K 4Gb FC / RAID 5
SAN TYPE / HBAs: Emulex dual port 4Gb Fiber Channel, HP StorageWorks 2Gb SAN switch
OTHER: Disk.SchedNumReqOutstanding and HBA queue depth set to 64 

Fibre Channel SAN Fabric Test

Test Name Avg. Response Time Avg. I/O per Second Avg. MB per Second
Max Throughput – 100% Read 1.62 35,261.29 1,101.92
Real Life – 60% Rand / 65% Read 16.71 2,805.43 21.92
Max Throughput – 50% Read 5.93 10,028.25 313.38
Random 8K – 70% Read 11.08 3,700.69 28.91
  
 
SERVER TYPE: Windows Server 2003 R2 VM ON ESXi 4.0 U1
CPU TYPE / NUMBER: VCPU / 1 / 1GB Ram (thin provisioned)
HOST TYPE: HP DL385 G2, 16GB RAM; 2x QC AMD Opteron 2356 Barcelona
STORAGE TYPE / DISK NUMBER / RAID LEVEL: EMC Celerra NS-120 / 15x 146GB 15K 4Gb FC / 3x RAID 5 5×146
SAN TYPE / HBAs: swISCSI
OTHER: Shared NetGear 1Gb SoHo Ethernet switch

swISCSI Test

Test Name Avg. Response Time Avg. I/O per Second Avg. MB per Second
Max Throughput – 100% Read 17.52 3,426.00 107.06
Real Life – 60% Rand / 65% Read 14.33 3,584.53 28.00
Max Throughput – 50% Read 11.33 5,236.50 163.64
Random 8K – 70% Read 15.25 3,335.68 22.06
  
 
SERVER TYPE: Windows Server 2003 R2 VM ON ESXi 4.0 U1
CPU TYPE / NUMBER: VCPU / 1 / 1GB Ram (thin provisioned)
HOST TYPE: HP DL385 G2, 16GB RAM; 2x QC AMD Opteron 2356 Barcelona
STORAGE TYPE / DISK NUMBER / RAID LEVEL: EMC Celerra NS-120 / 15x 146GB 15K 4Gb FC / 3x RAID 5 5×146
SAN TYPE / HBAs: NFS
OTHER: Shared NetGear 1Gb SoHo Ethernet switch

NFS Test

Test Name Avg. Response Time Avg. I/O per Second Avg. MB per Second
Max Throughput – 100% Read 17.18 3,494.48 109.20
Real Life – 60% Rand / 65% Read 121.85 480.81 3.76
Max Throughput – 50% Read 12.77 4,718.29 147.45
Random 8K – 70% Read 123.41 478.17 3.74

Please read further below for futher NFS testing results after applying EMC Celerra best practices

Fibre Channel Summary

Not surprisingly, Celerra over SAN fabric beats the pants off of the shared storage solutions I’ve had in the lab previously, HP MSA1000 and Openfiler 2.2 swISCSI before that, in all four IOMETER categories.  I was, however, pleasantly surprised to find that Celerra over fibre channel was one of the top performing configurations among a sea of HP EVA, Hitachi, NetApp, and EMC CX series frames.

swISCSI Summary

Celerra over swISCSIwas only slightly faster than the Openfiler 2.2 swISCSI on HP Proliant ML570 G2 hardware I had in the past on the Max Throughput-100%Read test. In the other three test categories, however, the Celerra left the Openfiler array in the dust.

NFS Summary

Moving on to Celerra over NFS, performance results were consistent with swISCSI in two test categories (Max Throughput-100%Read and Max Throughput-50%Read), but NFS performance numbers really dropped in the remaining two categories as compared to swISCSI (RealLife-60%Rand-65%Read and Random-8k-70%Read). 

What’s worth noting is that both the iSCSI and NFS datastores are backed by the same logical Disk Group and physical disks on the Celerra.  I did this purposely to compare the iSCSI and NFS protocols, with everything else being equal.  The differences in two out of the four categories are obvious.  The question came to mind:  Does the performance difference come from the Celerra, the VMkernel, or a combination of both?  Both iSCSI and NFS have evolved into viable protocols for production use in enterprise datacenters, therefore, I’m leaning AWAY from the theory that the performance degradation over NFS stems from the VMkernel. My initial conclusion here is that Celerra over NFS doesn’t perform as well with Random Read disk I/O patterns.  I welcome your comments and experience here.

Please read further below for futher NFS testing results after applying EMC Celerra best practices

CIFS

Although I did not test CIFS, I would like to take a look at its performance.  CIFS isn’t used directly by VMware virtual infrastructure, but it can be a handy protocol to leverage with NFS storage.  File management (ie. .ISOs, templates, etc.) on ESX NFS volumes becomes easier and more mobile and less tools are required when the NFS volumes are presented as CIFS shares on a predominantly Windows client network.  Providing adequate security through CIFS will be a must to protect the ESX datastore on NFS.

If you’re curious about storage array configuration and its impact on performance, cost, and availability, take a look at this RAID triangle which VMTN Master meistermn posted in one of the performance threads:

The Celerra stroage is currently carved out in the following way:

  0 1 2 3 4 5 6 7 8 9 10 11 12 13 14  
DAE 2 FC FC FC FC FC FC FC FC FC FC FC FC FC FC FC DAE 2
DAE1 NAS NAS NAS NAS NAS Spr Spr                 DAE 1
DAE 0 Vlt Vlt Vlt Vlt Vlt NAS NAS NAS NAS NAS NAS NAS NAS NAS NAS DAE 0
  0 1 2 3 4 5 6 7 8 9 10 11 12 13 14  

FC = fibre channel Disk Group

NAS = iSCSI/NFS Disk Groups

Spr = Hot Spare

Vlt = Celerra Valut drives

I’m very pleased with the Celerra NS-120.  With the first batch of tests complete, I’m starting to formulate ideas on when, where, and how to use the various storage protocols with the Celerra.  My goal is not to eliminate use of the slowest performing protocol in the lab.  I want to work with each of them on a continual basis to test future design and integration with VMware virtual infrastructure.

Update 1/30/10: New NFS performance numbers.  I’ve begun working with EMC vSpecialist to troubleshoot the performance descrepancies between swISCSI and NFS protocols.  A few key things have been identified and a new set of performance metrics have been posted below after making some changes:

  1. The first thing that the EMC vSpecialists (and others on the blog post comments) asked about was whether or not the file system uncached write mechanism was enabled. The uncached write mechanism is designed to improve performance for applications with many connections to a large file, such as a virtual disk file of a virtual machine.  This mechanism can enhance access to such large files through the NFS protocol.  Out of the box, the factory default is the uncached write mechanism is disabled on the Celerra. EMC recommends this feature be enabled with ESX(i).  The beauty here is that the feature can be toggled while the NFS file system is mounted on cluster hosts with VMs running on it.  VMware ESX Using EMC Celerra Storage Systems pages 99-101 outlines this recommendation.
  2. Per VMware ESX Using EMC Celerra Storage Systems pages 73-74, NFS send and receive buffers should be divisible by 32k on the ESX(i) hosts.  Again, these advanced settings can be adjusted on the hosts while VMs are running and the settings do not require a reboot.  EMC recommended a value of 64 (presumably for both).
  3. Use the maximum amount of write cache possible for Storage Processors (SPs). Factory defaults here:  598BM total read cache size, 32MB read cache size, 598MB total write cache size, 566MB write cache size.
  4. Specific to this test – verify that the ramp up time is 120 seconds.  Without the ramp up the results can be skewed. The tests I originall performed were with a 0 second ramp up time.

The new NFS performance tests are below, using some of the recommendations above: 

SERVER TYPE: Windows Server 2003 R2 VM ON ESXi 4.0 U1
CPU TYPE / NUMBER: VCPU / 1 / 1GB Ram (thin provisioned)
HOST TYPE: HP DL385 G2, 16GB RAM; 2x QC AMD Opteron 2356 Barcelona
STORAGE TYPE / DISK NUMBER / RAID LEVEL: EMC Celerra NS-120 / 15x 146GB 15K 4Gb FC / 3x RAID 5 5×146
SAN TYPE / HBAs: NFS
OTHER: Shared NetGear 1Gb SoHo Ethernet switch

New NFS Test After Enabling the NFS file system Uncached Write Mechanism

VMware ESX Using EMC Celerra Storage Systems pages 99-101

Test Name Avg. Response Time Avg. I/O per Second Avg. MB per Second
Max Throughput – 100% Read 17.39 3,452.30 107.88
Real Life – 60% Rand / 65% Read 20.28 2,816.13 22.00
Max Throughput – 50% Read 19.43 3,051.72 95.37
Random 8K – 70% Read 19.21 2,878.05 22.48
Significant improvement here!  
 
 
SERVER TYPE: Windows Server 2003 R2 VM ON ESXi 4.0 U1
CPU TYPE / NUMBER: VCPU / 1 / 1GB Ram (thin provisioned)
HOST TYPE: HP DL385 G2, 16GB RAM; 2x QC AMD Opteron 2356 Barcelona
STORAGE TYPE / DISK NUMBER / RAID LEVEL: EMC Celerra NS-120 / 15x 146GB 15K 4Gb FC / 3x RAID 5 5×146
SAN TYPE / HBAs: NFS
OTHER: Shared NetGear 1Gb SoHo Ethernet switch

New NFS Test After Configuring
NFS.SendBufferSize = 256 (this was set at the default of 264 which is not divisible by 32k)
NFS.ReceiveBufferSize = 128 (this was already at the default of 128)

VMware ESX Using EMC Celerra Storage Systems pages 73-74

Test Name Avg. Response Time Avg. I/O per Second Avg. MB per Second
Max Throughput – 100% Read 17.41 3,449.05 107.78
Real Life – 60% Rand / 65% Read 20.41 2,807.66 21.93
Max Throughput – 50% Read  18.25  3,247.21  101.48
Random 8K – 70% Read  18.55  2,996.54  23.41
Slight change  
 
 
SERVER TYPE: Windows Server 2003 R2 VM ON ESXi 4.0 U1
CPU TYPE / NUMBER: VCPU / 1 / 1GB Ram (thin provisioned)
HOST TYPE: HP DL385 G2, 16GB RAM; 2x QC AMD Opteron 2356 Barcelona
STORAGE TYPE / DISK NUMBER / RAID LEVEL: EMC Celerra NS-120 / 15x 146GB 15K 4Gb FC / 3x RAID 5 5×146
SAN TYPE / HBAs: NFS
OTHER: Shared NetGear 1Gb SoHo Ethernet switch

New NFS Test After Configuring IOMETER for 120 second Ramp Up Time

Test Name Avg. Response Time Avg. I/O per Second Avg. MB per Second
Max Throughput – 100% Read  17.28  3,472.43  108.51
Real Life – 60% Rand / 65% Read  21.05  2,726.38  21.30
Max Throughput – 50% Read  17.73  3,338.72  104.34
Random 8K – 70% Read  17.70  3,091.17  24.15

Slight change

Due to the commentary received on the 120 second ramp up, I re-ran the swISCSI test to see if that changeded things much.  To fairly compare protocol performance, the same parameters must be used across the board in the tests.

SERVER TYPE: Windows Server 2003 R2 VM ON ESXi 4.0 U1
CPU TYPE / NUMBER: VCPU / 1 / 1GB Ram (thin provisioned)
HOST TYPE: HP DL385 G2, 16GB RAM; 2x QC AMD Opteron 2356 Barcelona
STORAGE TYPE / DISK NUMBER / RAID LEVEL: EMC Celerra NS-120 / 15x 146GB 15K 4Gb FC / 3x RAID 5 5×146
SAN TYPE / HBAs: swISCSI
OTHER: Shared NetGear 1Gb SoHo Ethernet switch

New swISCSI Test After Configuring IOMETER for 120 second Ramp Up Time

Test Name Avg. Response Time Avg. I/O per Second Avg. MB per Second
Max Throughput – 100% Read  17.79  3,351.07  104.72
Real Life – 60% Rand / 65% Read  14.74  3,481.25  27.20
Max Throughput – 50% Read  12.17  4,707.39  147.11
Random 8K – 70% Read  15.02  3,403.39  26.59

swISCSI is still performing slightly better than NFS on the Random Reads, however, the margin is much closer

At this point I am content, stroke, happy, (borrowing UK terminology there) with NFS performance.  I am now moving on to ALUA, Round Robin, and PowerPath/VE testing.  I set up NPIV over the weekend with the Celerra as well – look for a blog post coming up on that.

Thank you EMC and to the folks who replied in the comments below with your help tackling best practices and NFS optimization/tuning!

Lab Update

January 19th, 2010 by jason No comments »

I thought I’d post a lab update since John Troyer nudged me letting me know this week’s weekly podcast was focusing home labs for VCP and VCDX studies.

Read more here.  Scroll down to the Lab Update section.

Hyper9 Named One of 10 Virtualization Vendors to Watch in 2010

January 19th, 2010 by jason No comments »

Press Release:

Hyper9 Named One of 10 Virtualization Vendors to Watch in 2010

Company Concludes Banner Year, Closes Largest Quarter To-Date

AUSTIN, Texas – Jan. 20, 2010 – Despite a tough economy and increased competition
in the virtualization market, Hyper9, Inc. today announced the close of a banner year in
2009, capped off by a fourth quarter that was the company’s strongest quarter to-date.
Demonstrating positive momentum across all areas of the business, Hyper9 won
numerous industry accolades in 2009, most recently landing on CIO.com’s third-annual
list of intriguing innovators in virtualization management, 10 Virtualization Vendors to
Watch in 2010
.

“Virtualization is no longer a buzzword that people just talk about,” said Bill Kennedy,
CEO of Hyper9. “In 2009, more enterprises embraced virtualization as an effective way
to optimize IT operations. As organizations continue to face the challenge of doing more
with less, virtualization will play a strategic role in enhancing the performance and agility
of key business initiatives.”

Hyper9 attributes its success to several key factors, including new product innovation, an
expanded customer base across numerous industries, strategic partnerships and
industry accolades. Recent accomplishments include:

  • Sales – 4Q09 was the company’s largest quarter to-date, with bookings four-
    times larger than the previous quarter. New contracts came from both private and
    public sectors across multiple verticals, including travel, sports and
    entertainment, consumer goods and technology. Key customer wins included:
    HomeAway, the National Football League, Major League Baseball and Whole
    Foods, among others.
  • Product Innovation – Product innovation continued with the launch of Hyper9’s
    Virtual Environment Optimization Suite, a second-generation virtualization
    management solution that provides enhanced business insights to address the
    growing demands of virtualized applications. The company also unveiled an
    open-sourced version of its Virtualization Mobile Manager.
  • Strategic Partnerships – Alliances with key services providers extended
    Hyper9’s reach in Canada, Ireland and the United Kingdom, while providing
    expanded integration and service capabilities for customers. New partners
    include: IGI, INX, IVOXY Consulting LLC, Softchoice, Righttrac and DNM.
  • Industry Accolades – Several industry analyst firms published reports
    highlighting Hyper9’s virtualization innovation, including Gartner’s Cool Vendor in
    IT Operations and Virtualization and Taneja Group’s whitepaper, Business-
    Driven Virtualization: Optimizing Insight and Operational Efficiency in the Dynamic
    Datacenter
    . Additionally, the company kicked off 2010 being named
    One of Ten Virtualization Vendors to Watch in 2010 by CIO.com, and being listed
    as a featured vendor in Gartner’s report Virtualization is Bringing Together
    Configuration and Performance Management.

Virtualization has quickly evolved into a strategic enabling technology now widely
deployed at all levels of the IT stack – from servers and desktops to networks, storage
and applications. Hyper9’s flagship product, Virtual Environment Optimization Suite,
helps organizations virtualize more resources, faster, to meet today’s sophisticated
business requirements.

About Hyper9, Inc.
Hyper9 is a privately-held company backed by Venrock, Matrix Partners, Silverton
Partners and Maples Investments. Based in Austin, Texas, the company was founded in
2007 by enterprise systems management experts and virtualization visionaries. Since
then, Hyper9 has collaborated with virtualization administrators as well as systems and
virtualization management experts to develop a new breed of virtualization management
products that leverages Internet technologies like search, collaboration and social
networking. The end result is a product that helps administrators discover, organize and
make use of information in their virtual environment, yet is as easy to use as a consumer
application. For more information about Hyper9, visit
www.hyper9.com.


VMware VI3 Implementation and Administration

January 11th, 2010 by jason No comments »

I recently finished reading the book VMware VI3 Implementation and Administration by Eric Siebert (ISBN-13: 978-0-13-700703-5).  VMware VI3 Implementation and Administration was a very enjoyable read. I don’t mean to sound cliché but for me it was one of those books that is hard to put down. Released in May of 2009, along with the next generation of VMware IV (vSphere), the timing of its arrival to market probably could have been better, but better late than never. Datacenters will be running on VI3 for quite some time. With that in mind, this book provides a tremendous amount of value and insight. I can tell that Eric put a lot of time and research into this book; the quality of the content shows. Much of the book was review for me, but I was still able to pick up bits and pieces here and there I wasn’t aware of, as well as some fresh perspective and new approaches to design, administration, and support.

To be honest and objective, I felt that Chapter 9, “Backing Up Your Virtual Environment”, lacked the completeness which all other chapters were given. A single page was dedicated to VMware Consolidated Backup with no detailed examples or demonstrations of how to use it, which would have been found throughout other chapters. To add, there was only a few sentences covering Replication which is a required component in many environments. Eric likes to discuss 3rd party solutions and this would have been a great opportunity to go into more detail or at least mention some products affordable to businesses of any size which could leverage replication solutions.

Overall, this is a great book. Eric has a no-nonsense writing style backed by decades of in the trench experience. Along with the print copy, you get a free electronic online edition as well allowing you to access the book anywhere where there is internet connectivity.  Pick up your copy today!  I thank you Eric and look forward to your upcoming vSphere book!

Unboxing the EMC Celerra NS-120 Unified Storage

January 8th, 2010 by jason No comments »

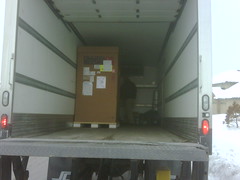
Wednesday was a very exciting day! A delivery truck dropped off an EMC Celerra NS-120 SAN. The Celerra NS-120 is a modern entry-level unified storage solution which supports multiple storage protocols such as Fibre Channel (block), iSCSI (block), and NAS (file). This hardware is ideal for the lab, development, QA, small and medium sized businesses, or as a scalable building block for large production datacenters. The NS-120 is a supported storage platform for VMware Virtual Infrastructure which will utilize all three storage protocols mentioned above. It is also a supported on other VMware products such as Site Recovery Manager, Lab Manager, and View.

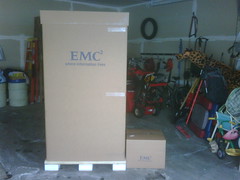
The Celerra arrived loaded in an EMC CX4 40u rack, nicely cabled and ready to go. Storage is comprised of three (3) 4GB DAE shelves and 45 146GB 15K RPM 4GB drives for about 6.5TB RAW. The list of Bundled software includes:
Navisphere Manager
Navisphere QoS Manager
SnapView
MirrorView/A
PowerPath
Many others

There is so much more I could write about the Celerra, but the truth of the matter is that I don’t know a lot about it yet.  The goal is to get it set up and explore its features.  I’m very interested in comparing FC vs. iSCSI vs. NFS.  DeDupe, Backup, and Replication are also areas I wish to explore.  Getting it online will take some time.  The Electrician is scheduled to complete his work on Saturday; two 220 Volt 30 Amp Single Phase circuits are being installed.  When it will actually be powered on and configured is up in the air right now.  Its final destination is the basement and it will take a few people to help get it down there.  Whether or not it can be done while the equipment is racked or during the winter is another question.  I really don’t want to unrack/uncable it but I may have to just to move it.  Another option would be to hire a moving company.  They have strong people and are very creative; they move big awkward things on a daily basis for a living.

Unloading it from the truck was a bit of a scare but it was successfully lowered to the street.  Weighing in at over 1,000 lbs., it was a challenge getting it up the incline of the driveway with all the snow and ice. We got it placed in its temporary resting place where the unboxing could begin.

The video

I’ve seen a few unboxing videos and although I’ve never created one, I thought this would be a good opportunity as this is one of the larger items I’ve unboxed. It’s not that I wanted to, but I get the sense that unboxing ceremonies are somewhat of a cult fascination in some circles and this video might make a good addition to someone’s collection.  There’s no music, just me. If you get bored or tired of my voice, turn on your MP3 player.  Enjoy!

EMC Celerra NS-120 Unboxing Video pt1 from Jason Boche on Vimeo.

EMC Celerra NS-120 Unboxing Video pt2 from Jason Boche on Vimeo.

EMC Celerra NS-120 Unboxing Video pt3 from Jason Boche on Vimeo.