Last month, I attended Gestalt IT Tech Field Day in Boston. This is an independent conference made up of hand selected delegates and sponsored by the technology vendors whom we were visiting. All of the vendors boast products which tie into a virtualized datacenter which made the event particularly exciting for me!
One of the vendors we met with is VKernel. If you’re a long time follower of my blog, you may recall a few of my prior VKernel posts including VKernel CompareMyVM. Our VKernel briefing covered Capacity Analyzer. This is a product I actually looked at in the lab well over a year ago, but it was time to take another peek to see what improvements have been made.
Before I get into the review, some background information on VKernel:
VKernel helps systems administrators manage server and storage capacity utilization in their virtualized datacenters so they can:
- Get better utilization from existing virtualization resources
- Avoid up to 1/2 the cost of expanding their virtualized datacenter
- Find and fix or avoid capacity related performance problems
VKernel provides easy to use, highly affordable software for systems managers that:
- Integrates with their existing VMware systems
- Discovers their virtualized infrastructure and
- Determines actual utilization vs. provisioned storage, memory, and CPU resources
And the VKernel Capacity Analyzer value proposition:
Capacity Analyzer proactively monitors shared CPU, memory, network, and disk (storage and disk I/O) utilization trends in VMware and Hyper-V environments across hosts, clusters, and resource pools enabling you to:
- Find and fix current and future capacity bottlenecks
- Safely place new VMs based on available capacity
- Easily generate capacity utilizatino alerts
Capacity Analyzer lists for $299/socket, however, VKernel was nice enough to provide each of the delegates with a 10 socket/2 year license which was more than adequate for evaluation in the lab. From this point forward, I will refer to Capacity Analyzer as CA.
One of the things which was noticed right away by another delegate and by myself was the quick integration and immediate results. CA 4.2 Standard Edition ships as a virtual appliance in OVF or Converter format. The 32-bit SLES VM is pre-built, pre-configured, and pre-optimized for the role which it was designed for in the virtual infrastructure. The 600MB appliance deploys in just minutes. The minimum deployment tasks consist of network configuration (including DHCP support), licensing, and pointing at a VI3 or vSphere virtual infrastructure.
CA is managed by HTTP web interface which has been the subject of noticable improvement and polishing since the last time I reviewed the product. The management and reporting interface is presented in a dashboard layout which makes use of the familiar stoplight colors. A short period of time after deployment, I was already seeing data being collected. I should note that the product supports management of multiple infrastructures. I pointed CA at VI3 and vSphere vCenters simultaneously.
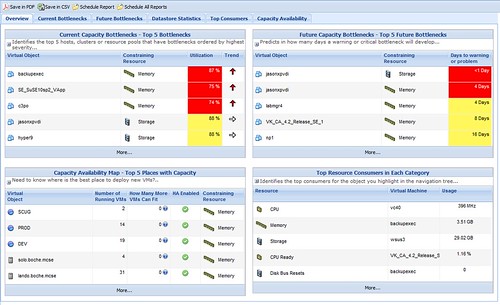
One of the dashboard views in CA is the “Top VM Consumers” for metrics such as CPU, Memory, Storage, CPU Ready, Disk Bus Resets, Disk Commands Aborted, Disk Read, and Disk Write. The dashboard view shows the top 5, however, detailed drilldown is available which lists all the VMs in my inventory.

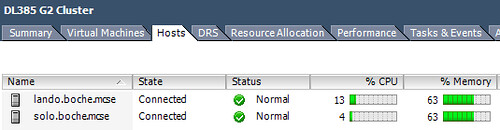
Prior to deploying CA, I felt I had a pretty good feel for the capacity and utilization in the lab. After letting CA digest the information available, I thought it would be interesting to compare results provided by CA with my own perception and experience. I was puzzled by the initial findings. Consider the following physical two node cluster information from vCenter. Each node is configured identically with 2xQC AMD Opteron processors and 16GB RAM. Each host is running about 18 powered on VMs. Host memory is and always has been my limiting resource, and it’s evident here, however, with HA admission control disabled, there is still capacity to register and power on several more “like” VMs.
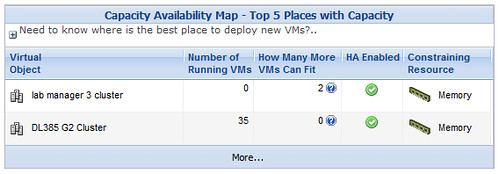
So here’s where things get puzzling for me. Looking at the Capacity Availability Map, CA is stating
1) Memory is my limiting resource – correct
2) There is no VM capacity left on the DL385 G2 Cluster – that’s not right
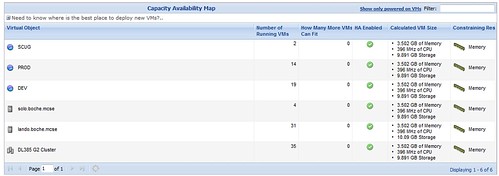
After further review, the discrepancy is revealed. The Calculated VM Size (slot size if you will) for memory is at 3.5GB. I’ not sure where CA is coming up with this number. It’s not the HA calculated slot size, I checked. 3.5GB is nowhere near the average VM memory allocation in the lab. Most of my lab VMs are thinly provisioned from a memory standpoint since host memory is my limiting resource. I’ll need to see if this can be adjusted because these numbers are not accurate, thus not reliable. I wouldn’t want to base a purchasing decision on this information.
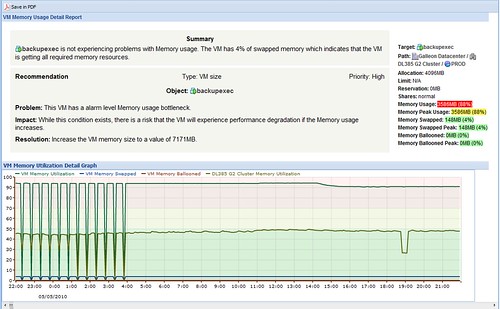
Here’s an example of a drilldown. Again, I like the presentation, although this screen seems to have some justification inconsistencies (right vs. center). Reports in CA can be saved in .PDF or .CSV format, making them ideal for sharing, collaboration, or archiving. Another value add is a recommendation section which is stated in plain English in the event the reader is unable to interpret the numbers. What I’m somewhat confused about is fact that the information provided in different areas is contradicting. In this case, the summary reports VM backupexec “is not experiencing problems with memory usage… the VM is getting all required memory resources”. However, it goes on to say there is a problem in that there exists a Memory usage bottleneck… the VM may experience performance degradation if memory usage increases. Finally, it recommends incresaing the VM memory size to almost double the currently assigned value – and this Priority is ranked as High.
It’s not clear to me from the drilldown report if there is a required action here or not. With the high priority status, there is a sense of urgency, but to do what? The analysis states performance could suffer if memory usage increases. That typically will be the case for virtual or physical machines alike. The problem as I see it is the analysis is concerned with a future event of which may or may not occur. If the VM has shown no prior history of higher memory consumption and there is no change to the application running in the VM, I would expect the memory utilization to remain constant. VKernel is on the right track, but I think the out-of-box logic needs tuning so that it is more intuitive. Else this is a false alarm which would cause me to overutilize host capacity or I would learn to ignore which is dangerous and provides no return on investment in a management tool.
I’ve got more areas to explore with VKernel Capacity Analyzer and I welcome input, clarification, corrections from VKernel. Overall I like the direction of the product and I think VKernel has the potential to service capacity planning needs for virtual infrastructures of all sizes. The ease in deployment provides rapid return. As configuration maximums and VM densities increase, capacity planning becomes more challenging. When larger VMs are deployed, significant dents are being made in the virtual infrastructure causing shared resources to deplete more rapidly per instance than in years past. Additional capacity takes time to procure. We need to be able to lean on tools like these to provide the automated analysis and alarms to stay ahead of capacity requests and not be caught short on infrastructure resources.


Did you get any clarification from VKernel on these issues?
I’ll be working with VKernel this week on them. I’ll be sure to post a follow up.
Jason,
this has been my complaint about vkernel as well. The discrepancies between vCenter or even within the product itself are sometimes mind boggling. I believe they’re working to fix some of these things and I have been working with some of their technicians as well.
It’s important that a product like this provides the right information especially as we push cloud solutions with vSphere etc. Another limiting factor with the product is the inconsistent Disk I/O (datasore throughput) bandwidth information. I have been asking them for this information so I can trend my capacity and bandwidth on all Datastores etc and again they fall short.
Not sure if I will be renewing my subscription with them. Waiting to see.
Thanks for this, its now Jan 2011, and yeterday I download the trial to possibly help me look at NFS latencies and other things and I got the same thing.
Example I have a 8 – way cluster, each server has dual 6-core CPU’s with 72gig’s of RAM. Looking at the cluster in vcenter I see every host using about 48% of the RAM, and low CPU. Yet this tool says I can add just one more guest????
No thanks.