VMware introduced the VMware Descheduled Time Accounting Service as a new VMware Tools component in ESX 3.0. The goal was to account for inconsistent CPU cycles allocated to the guest VM by the VMkernel to provide accurate performance statistics using standard performance monitoring tools within the guest VM. Although the service was not installed and enabled with VMware Tools by default, nor did it ever escape the bonds of experimental support status, I found the service to be both stable and reliable and it was a standard installation component in one of my production datacenters. One caveat was that the service only supported uniprocessor guest VMs having a single vCPU.
The VMware Descheduled Time Accounting Service was deprecated in VMware vSphere. More accurately, it was sort of replaced by a new vSphere feature called Virtual Machine Performance Counters (Integrated into Perfmon). To quote VMware:
“Virtual Machine Performance Counters Integration into Perfmon — vSphere 4.0 introduces the integration of virtual machine performance counters such as CPU and memory into Perfmon for Microsoft Windows guest operating systems when VMware Tools is installed. With this feature, virtual machine owners can do accurate performance analysis within the guest operating system. See the vSphere Client Online Help.”
The vSphere Client Online Help has this to say about Virtual Machine Performance:
“In a virtualized environment, physical resources are shared among multiple virtual machines. Some virtualization processes dynamically allocate available resources depending on the status, or utilization rates, of virtual machines in the environment. This can make obtaining accurate information about the resource utilization (CPU utilization, in particular) of individual virtual machines, or applications running within virtual machines, difficult. VMware now provides virtual machine-specific performance counter libraries for the Windows Performance utility. Application administrators can view accurate virtual machine resource utilization statistics from within the guest operating system’s Windows Performance utility.”
Did you notice the explicit statement about Perfmon? Perfmon is Microsoft Windows Performance Monitor or perfmon.exe for short. Whereas the legacy VMware Descheduled Time Accounting Service supported both Windows and Linux guest VMs, its successor currently supports Perfmon ala Windows guest VMs only. It seems we’ve gone backwards in functionality from a Linux guest VM perspective. Another pie in the face for shops with Linux guest VMs.
Rant…
I understand that Windows guest VMs are the low hanging fruit for software development and features, but VMware needs to make sure some love is spread through the land of Linux as well. Folks with Linux shops are still struggling with basic concepts such as Linux guest customization as well as flexibility and automation of VMware Tools installation in the Linux guest OS. If VMware is going to tout their support for Linux guest VMs, I’d like to see more of a commitment than what is currently being offered. There’s more to owning a virtualized infrastructure than powering on instances on top of a hypervisor. Building it is the easy part. Managing it can be much more difficult without the right tools. Flexibility and ease with in the management tools is critical, especially as virtual infrastructures grow.
/Rant…
So, taking a look at a VMware vSphere Windows VM with current VMware Tools, I launched Perfmon. The installation of VMware Tools installs two new Performance Objects along with various associated counters:
- VM Memory
- Memory Active in MB
- Memory Ballooned in MB
- Memory Limit in MB
- Memory Mapped in MB
- Memory Overhead in MB
- Memory Reservation in MB
- Memory Shared in MB
- Memory Shared Saved in MB
- Memory Shares
- Memory Swapped in MB
- Memory Used in MB
- VM Processor
- % Processor Time
- Effective VM Speed in MHz
- Host processor speed in MHz
- Limit in MHz
- Reservation in MHz
- Shares
Observing some of the counter names, it’s interesting to see that VMware has given us direct insight into the hypervisor resource configuration settings via Performance Monitor from inside the guest VM. While this may be useful for VI Administrators who manage both the VI as well as the guest operating systems, it may be disservice to VI Administrators in environments where guest OS administration is delegated to another support group. The reason why I say this is that some of these new counters disclose an “over commit” or “thin provisioning” of virtual hardware resources which I’d rather not reveal to other supports groups. What they don’t know won’t hurt them. Revealing some of the tools in our bag of virtualization tricks may bring about difficult discussions we don’t really want to get into or perhaps provoke the finger of blame to be perpetually pointed in our direction whenever a guest OS problem is encountered.
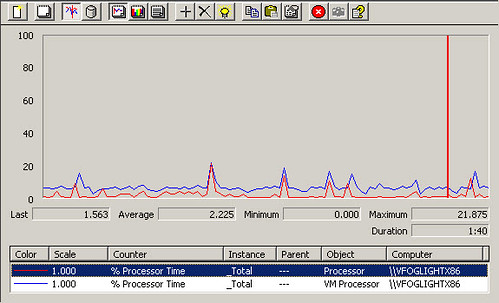
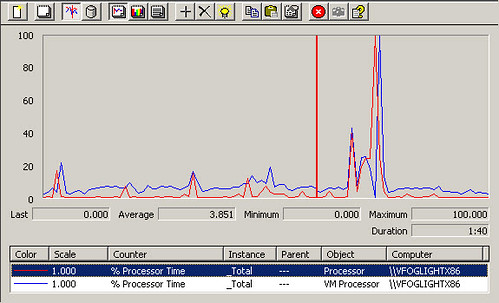
I’ve grabbed a few screen shots from my lab which show the disparity between native Perfmon metrics and the new vSphere Virtual Machine Performance Counters. In this example, I compare %Processor Time from the Perfmon native Processor object against the %Processor Time from the VM Processor object which was injected into the VM during the vSphere VMware Tools installation. It’s interesting to note, and you should be able to clearly see it in the graph, that the VM Processor %Processor time is consistently double that of the Perfmon native Processor % Processor Time counter. Consider this when you are providing performance information for a guest VM or one of its applications. If you choose the native Perfmon counter, you could be reporting performance data with 100% margin of error as shown in the case below. This is significant and if used for capacity planning purposes could lead to all sorts of problems.
One other important item to note is that you may recall I said towards the beginning that the legacy VMware Descheduled Time Accounting Service only supported uniprocessor VMs. The same appears to be true for the new vSphere Virtual Machine Performance Counters. In the lab I took a single CPU VM which had the vSphere Virtual Machine Performance Counters, and I adjusted the vCPU count to 4. After powering on with the new vCPU count, the vSphere Virtual Machine Performance Counters disappeared from the pulldown list. VMware needs to address this shortcoming. Performance statistics on vSMP VMs are just as important, if not more important, than performance statistics on uniprocessor VMs. vSMP VM resource utilization needs to be watched more closely for vSMP justification purposes.
So VMware, in summary, here is what needs work with vSphere Virtual Machine Performance Counters:
- Must support vSMP VMs
- Must support Linux VMs
- Support for Solaris VMs would also be nice
- More objects: VM Disk and VM Networking
Update: On Friday July 11th, 2009, I received the following email response from Praveen Kannan, a VMware Product Manager. Praveen has given me permission to reprint the response here. It is an encouraging read:
Hi Jason,
I read your recent blog post on the Perfmon integration in vSphere 4.0. I’m the product manager for the feature and wanted to reach out to on your findings and feedback regarding the feature.
First off, thanks for the detailed post on the intricacies of the feature and the screenshots. I think this post would be very helpful to the community! Much appreciated…
1) note on vmdesched
We’ve deprecated vmdesched in vSphere 4.0 because it was primarily an experimental feature that we didn’t recommend putting in production. More importantly, vmdesched adds overhead to the guest and is not compatible with some of the newer kernels out there and so the Perfmon integration is our answer to improve on the current state and provide accurate CPU accounting to VM owners that can be deployed in production and is integrated well with VMware Tools for out-of-box functionality.
2) Linux support for accurate counters
The Perfmon integration in vSphere 4.0 leverages the guest SDK API to get to the accurate counters from the hypervisor and that is available on Linux GOS as well. All you need is to have the VMware Tools installed to get access to the guest SDK interface. We couldn’t provide something like Perfmon on Linux since there aren’t many broadly used tools/APIs that we can standardize on.
There are some discussions internally to solve the accounting issue on Linux guests in a much simplified manner but I can’t go into the specific details at this time. Rest assured, I can tell you that we are looking into the problem for Linux workloads.
On a side note, the Perfmon implementation exposes the two new counter groups through WMI (you can almost think of the Perfmon integration as a WMI provider that sits on top of the guest SDK interface and provide access to the counters). What this means is any in-guest agent, benchmarking, reporting tool etc. can quickly adapt to use these “accurate” counters using WMI
So for Linux guests, you can refer to the guest SDK documentation on how someone can modify their Linux agents, tools etc. to talk to the “accurate” counters. The programming guide for vSphere guest SDK 4.0 is available at http://www.vmware.com/support/developer/guest-sdk/. The list of available perf counters is in Page 11 of the PDF (Accessor functions for VM data).
You can in fact use the older 3.5 version of the guest SDK API as well if you want to implement something that works with existing VI3 environments (yes, this SDK has been around for a while!). The only difference is that the vSphere version of the API has a few extra counters but you will get access to the important counters such as CPU utilization in the older API itself.
3) over commit, thin provisioning counters
Interesting feedback that I’ll take back to engineering 🙂 This is something that we need to think about for sure
4) uni-processor Perfmon?
I’m really surprised with your observations after moving to a 4 vCPUs. Not sure what’s going on but AFAIK, we report the _Total (aggregate) of all CPU utilization in one metric in the “VM Processor” counter group in Perfmon. What that means is regardless of how many CPUs in-guest, we do provide the _Total of CPU Utilization. Maybe you may have run into a bug. I’ll check with engineering on this anyways to confirm my understanding.
Just so you know we have a “standalone” version of the Perfmon tool that works with existing VI 3.5 environments. We’ve posted details about this experimental tool and the binaries on our performance blog here:
http://communities.vmware.com/blogs/drummonds/2009/06/18/using-perfmon-for-accurate-esx-performance-counters
The reason I mentioned the standalone version is because on my test box running 3.5 with the standalone version of Perfmon, I was able to see the _Total on a 2 vCPU VM. I haven’t yet tested your findings on a vSphere test box yet but I look into it…
So to help us investigate this, could you please do the following?
a. re-install VMware tools on a test Windows VM after switching to 4 vCPUs and check if the problem is reproducible
b. if you have the 3.5 version of VMware tools running on a VI3 setup, download the standalone version of the Perfmon tool and install it on a Windows VM and check if the 4-vCPU problem is observed. I haven’t tested the same standalone version of Perfmon on a vSphere 4.0 setup (with 4.0 version of the tools) but I wouldn’t be surprised if the standalone version does work. You may want to snapshot the VM before you attempt this though so you can rollback.
5) more counters such as disk and networking
Some background…our main focus in 4.0 was to solve the immediate customer pain-point, namely the CPU accounting issue inside the guest for VM owners. Also, what we heard is that VI admins didn’t want to give out VI client access to VM owners whenever they wanted to look at “accurate” counters for CPU utilization. In fact, the memory counters in Perfmon were sort of a bonus since it was already available in the guest SDK interface 🙂
Importantly, other counters when measured inside the guest such as Memory, Disk and Network don’t really suffer from accounting problems (i.e. they are accurate) as compared to CPU utilization numbers captured over a period of time (which may be accounted different due to the scheduling and de-scheduling the hypervisor does). So the numbers for Disk, Memory and Network when captured inside the Windows guest will be the same as the VI client.
However, I do recognize that as more and more customers start using this integration, there will soon be a need for providing disk and network counters as well. This is definitely on my radar to address in a future release.
Hope the information I provided helps in better understanding the Perfmon integration in vSphere 4.0 and also answer some of your questions in the blog post.
Looking forward to your findings with the 4 vCPU VMs. LMK if you have any questions in the interim.
P.S: Do feel free to use the information discussed here for your blog where you deem useful…
Have a good weekend…
—
Praveen Kannan
Product Manager
VMware, Inc.
After some more investigation in another test VM, I replied to Praveen with the following information:
Praveen,
In my previous test, I had a 1 vCPU Windows Server 2003 VM. The VM Memory
and VM Processor objects were listed in the pulldown lits in perfmon. After
upgrading the VM to 4 vCPUs, the VM Memory and VM Processor objects were no
longer listed in the pulldown list in perfmon. So you see, the objects were
not available thus the counters (including _Total) were not available.
Today, I deployed a 1 vCPU Windows Server 2003 VM from a 1 vCPU template.
When I ran perfrmon, the VM Memory and VM CPU objects were missing (VMware
Tools was up to date). I closed perfmon and reopened it. Then the 2 VM
objects were there.
Then I upgraded the VM to a 4 vCPU VM. I ran perfmon and both the VM
objects were there.
Following that, I encountered more problems. I was able to choose the VM Processor object, but the counters for the object were all missing. Definitely a bug somewhere with these. Please advise.


Nice overview of the new Perfmon integration.
I suspect that the typical admin of any hypervisor platform does not fully understand the implications of in-guest monitoring.
Reinforces the point that there is more to “managing physical and virtual” than just treating VMs like physical boxes.
Eric
While it gives people the same feel with the tools they know of in a guest, the limitation you point out are a result of the fact that it is difficult to provide a heterogeneous solution within the guest. So from a performance management perspective, it may be better off to approach it in a top down fashion and go to the guest only if absolutely needed. And for most of the times, an overall performance number from outside the guest would suffice IMO.
Great post Jason! As always you do a great job of explaining an often mis-understood topic
Interesting observation…VM Processor %Processor time is consistently double that of the Perfmon native Processor % Processor Time counter
What do you think accounts for the difference, VMKernel overhead,CPU Ready or something else?
Building on the proven power of the VMware Infrastructure platform, which is used by more than 130,000 customers, VMware vSphere dramatically reduces capital and operating costs and increases control over delivery of IT services, while preserving the flexibility to choose between any type of operating system, application, and hardware.
———————-
Leo
Server virtualization can dramatically improve the efficiency and availability of hardware resources and applications. But as operating systems and applications are decoupled from the network, physical servers, and storage devices, it becomes more and more difficult to monitor, troubleshoot, and manage your IT infrastructure from end to end.
http://www.solarwinds.com
Very nice job. Very clear and concise. I appreciate the feedback from VMWare as well.
Thanks a ton!
thanks for this wonderful post. I happen to come across vmware perfmon counters and your post has described them very well. I didn;t know that Disk IO is also captured accurately with guest machines’ perfmon.
Thanks
Good news. I recently implemented a python-vmguestlib wrapper that ships its own tool vmguest-stats for displaying those performance counters. And I have added 3 new plugins in Dstat specifically for those VMGuestLlib SDK counters.
So correlating these counters with other performance data is as simple as:
dstat -c –vm-cpu -m –vm-mem –vm-mem-adv
You can find the python wrappers and Dstat at:
http://github.com/dagwieers/vmguestlib
http://github.com/dagwieers/dstat
Feedback and improvements welcomed !