Pre Hitachi Data Systems Geek Day 2.0

March 22nd, 2011 by jason No comments »

SnagIt CaptureHitachi Data Systems Geek Day 2.0 starts tomorrow.  HDS has invited storage and virtualization experts from many points on the globe to come and be immersed in the latest storage solutions HDS has to offer.  The event kicks off at 8am, going into the evening, and wraps up Thursday afternoon.

Asked what in particular I would like HDS to cover, my response stemmed from the VMware Virtual Infrastructure/vCloud angle. Interests such as unified storage, VAAI support, plugin integration, scalability, storage virtualization update (USPV?), replication, and SRM integration.

HDS responded by putting together a two-day event which includes a VAAI demo session, and a presentation on the next wave of server and storage virtualization.  In addition to that, we’ll cover the converged datacenter, we’ll receive a Hitachi Clinical Repository overview and demo, Hitachi Command Suite 7.0 hands on, unified compute, and storage economics.

You can follow what the list of delegates have to say on Twitter by watching the hash tag #HDSDay.  We’re all bloggers so expect to see content from those respective sources as well.  From Pete Gerr’s blog:

The current list of distinguished bloggers making their way to Sefton Park, UK for the event includes:

Enterprise Storage is the key enabler for many VMware technologies and Tier 1 virtualized workloads.  I’m looking forward to what Hitachi has to showcase over the next couple of days in addition to seeing some faces I haven’t seen in a while and meeting new contacts in the storage industry.

Xangati Delivers First Solution for Managing VDI to Operational Scale

March 22nd, 2011 by jason No comments »

Press Release:

Xangati Delivers First Solution for Managing VDI to Operational Scale

New Virtual Desktop Infrastructure (VDI) Dashboard Leverages Powerful Performance Health Engine to Ensure Optimal End-user Experience

SnagIt CaptureCupertino, CA – March 22, 2011 – Xangati, the recognized leader in infrastructure performance management, today introduced the Xangati VDI Dashboard, the industry’s first solution designed to comprehensively track all key infrastructure components that affect VDI performance, giving administrators the confidence and ability to successfully implement large-scale VDI deployments.  Leveraging Xangati’s powerful real-time memory-based analytics engine architecture, the Xangati VDI Dashboard tracks and continuously monitors activity of all VDI components within the infrastructure without requiring any agents. The new dashboard also includes a performance health engine that automatically and visually alerts administrators in real-time about the precise location of performance issues.

By providing a solution that covers components in and outside of the virtual infrastructure (VI), the Xangati VDI Dashboard gives administrators comprehensive “cross silo” awareness into all critical elements linked to – including clients, desktops, networks, servers, storage, applications and VDI protocols – which ultimately provides a positive VDI user experience.

“The ultimate success of VDI projects depends 100 percent on the ability to provide users with the same level of application performance and availability that they are accustomed to in conventional desktop environments,” said Alan Robin, CEO of Xangati. “However, prior to the release of Xangati’s solution, VDI administrators were flying blind to the source of end-user performance issues not linked to their VDI software – oftentimes leading to stalled implementations and cancelled projects. Xangati is the first to market with a solution to tackle these challenges head on through a UI structured specifically for VDI support, an agent-free model, and a rapid installation process that provides immediate download to value.”

“Xangati has once again demonstrated its talent for developing and delivering innovative infrastructure performance management solutions that are needed to help businesses successfully implement and benefit from emerging and transformational technologies, such as VDI,” said Bernd Harzog, analyst of virtualization performance and capacity management at The Virtualization Practice. “Its new dashboard not only gives the highest level of visibility into all the moving parts in the VDI ecosystem but also extends its real-time and continuous monitoring to include proactive, system-generated health alerts and visual recordings about performance issues.”

Through relationships and support from VMware and Citrix, Xangati has designed the Xangati VDI Dashboard to fully complement both VMware View and Citrix XenDesktop environments.

Xangati VDI Dashboard: Breakthrough Features

Real-time Performance Health Engine

The cornerstone of the Xangati VDI Dashboard is its patent-pending performance health engine that analyzes the health of VDI in an unprecedented four microseconds. Relying on Xangati’s memory-driven architecture, the performance health of the VDI is being continuously monitored across a broad spectrum of performance metrics to the unrivaled scale of 250,000 objects (which can include desktops and clients). In contrast, other performance management architectures are database-driven and unable to keep apace of dynamic interactions to scale that are fundamental to VDI.

The output of Xangati’s performance health engine is a real-time health index that is linked to the health of every client, desktop, network link, host, VDI protocol and IT server that can impact VDI end–user experience. In real-time – as an object’s health shifts – the health index changes to reflect the urgency of the performance issue. Moreover, the performance shift will trigger a real-time alert, which is uniquely paired with a DVR-recording.

The DVR-recording will show exactly where the performance problem stems from and present contextual insights about what is driving the sub-optimal performance. For instance, a specific user community is seeing obvious delays in screen presentation due to a high latency network link. These DVR recordings capture issues that are often outside of a VDI vendor’s software framework and can be passed to the appropriate IT function, e.g. to the storage team when storage latency is at the heart of the performance issue.

All VDI Operations in a Single Pane of Glass

For the very first time, a VDI team can see in one pane of glass all the critical components that sustain the VDI, as well as the desktops and their clients. Through this structure, the Xangati solution is the only purpose-built dashboard framed to replicate how a VDI administrator seeks to run their operations. Additionally, the VDI dashboard incorporates Xangati’s visual trouble ticketing model that allows end-users to initiate DVR recordings when they are experiencing issues. In this manner, the VDI administrator can see, for example, that a user’s poor VDI experience on an iPad is due to a highly congested WiFi network.

In contrast to other solutions marketed as VDI-focused, the Xangati solution can populate itself with incredibly rich data without requiring guest software agents. It is this agent-free model that allows Xangati to be deployed rapidly, even during proof of concept phases, as well as when an enterprise wishes to scale their virtual desktops into the thousands or tens of thousands.

School District Earns an A+ in Performance with Xangati’s VDI Dashboard

Manchester Essex Regional School District (MERSD) turned to VDI last year as a way to enable faster provisioning and deployment of new desktops and reduce its operational costs. MERSD is an early adopter of the Xangati VDI Dashboard and is maximizing VDI benefits through the capabilities of its performance health engine.

“In order to keep our schools’ virtual computers running while school is in session, we must be able to quickly and accurately identify performance problems – ideally before they occur,” said Stephen Kwiatek, network administrator for MERSD. “Having a Health Index that alerts us to potential issues takes a huge load off of our shoulders by giving us an automated way to monitor the VDI infrastructure. This is a tremendous advantage in providing our staff and students with the highest quality of computing and the success of our VDI initiative. The Xangati VDI Dashboard is absolutely unique as a real-time window into our virtual world.”

Pricing and Availability

The Xangati VDI Dashboard is available immediately and can also be downloaded for a free two-week trial via the Xangati website. Priced at just $25 per desktop in a starter kit of 100 desktops, the Xangati VDI Dashboard enables a company to implement a VDI initiative for just $2,499 – making it one of the most affordable options today. For more information about the new Xangati VDI Dashboard and to start a free trial, go to http://xangati.com/VDI_dashboard.  

About Xangati

Xangati, the recognized leader in Infrastructure Performance Management (IPM), provides unparalleled performance management for the emerging and transformational data center architectures impacting IT today, including server virtualization, cloud computing and VDI. Its award-winning suite of IPM solutions accelerates cloud computing and virtualization initiatives by providing unprecedented visibility and real-time continuous insights into the entire infrastructure. Leveraging its powerful precision analytics, Xangati’s health performance index provides a new way to view and manage performance – in real-time – at a scale previously not possible.

Founded in 2006, Xangati, Inc. is a privately held company with corporate headquarters based in Cupertino, California. Xangati has been granted numerous technology patents for its unique and comprehensive approach to Infrastructure Performance Management. Xangati is a VMware Technology Alliance Partner and certified Citrix Ready Partner and supports VMware View and Citrix XenDesktop, as well as other virtualization environments. For more information, visit the company website at http://www.xangati.com.

EMC Celerra BETA Patch Pumps Up the NFS Volume

March 21st, 2011 by jason No comments »

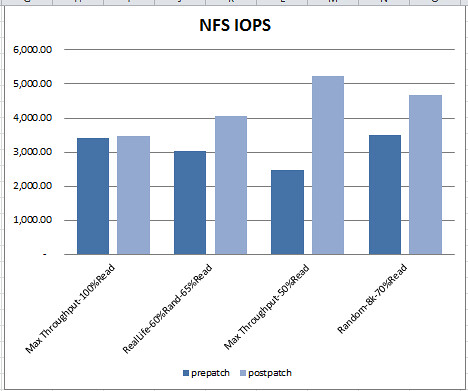
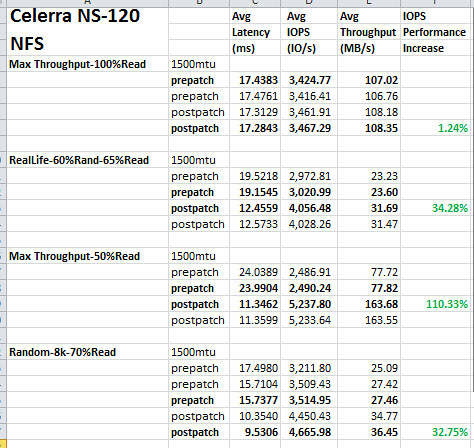
A while back, Chad Sakac of EMC announced on his blog that he is looking for customers to volunteer their storage arrays to run various performance tests in addition to a piece of NFS specific BETA code for DART.  Having installed the BETA code (which I’m told is basically a nas executable swap in), I proceeded to compare NFS performance results with baseline results I had captured pre-patch.  In most test cases, the improvements ranged from significant to over twice the performance gain.  Most of the performance gains appear to surround write I/O.

Following are the results comparing NFS performance with four different workload types before BETA patch and after BETA patch on a Celerra NS-120 with 15 x 15k spindles:

SnagIt Capture

Detailed supporting data.  Keep in mind the NFS patch is still BETA with no firm release date as of yet from EMC:

SnagIt Capture

This looks like great stuff from EMC and assuming the code reaches GA status, it would bolster the design choice of NFS in the datacenter.  Chad may still be looking test results for certain use cases.  If you’re interested in participating in the tests with your EMC array, please reach out to Chad using the comments section in Chad’s blog post linked above.

network bandwidth transfer.xlsx

March 19th, 2011 by jason 11 comments »

SnagIt CaptureMany years ago, before I got involved with VMware, before VMware existed in fact, I was a Systems Engineer supporting Microsoft Windows Servers.  I also dabbled in technology related things such as running game servers like Quake II and Half-Life Counter-Strike on the internet.  One area where these responsibilities intersected was the need to know the rate at which data could traverse a rated network segment in addition to the amount of time it would take for said data to travel from point A to point B. 

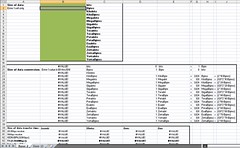
At that point in time, there wasn’t half a dozen free web based calculators which could be found via Google search.  As a result, I started an Excel spreadsheet.  It started out as a tool which would allow me to enter a value in KiloBytes, MegaBytes, or GigaBytes.  From there, it would calculate the amount of time it would take that data to travel across the wire.  This data was useful in telling me how many players the Counter-Strike could scale to, and it would provide an estimate for how much the bandwidth utilization was going to cost me per month.  I also used this information in the office to plan backup strategies, data transfer, and data replication.

I’ve expanded its capabilities slightly over the years as well as scaled it up to handle the volume of data we deal which has increased exponentially.  In addition to the functions it performed in the past, I added a data conversion section which translates anything to anything within the range of bits to YottaBytes.  It performs both Base 2 (binary) and Base 10 (decimal) calculations which are maintained on their own respective worksheet tabs.  I prefer to work with Base 2 because it’s old school and I believe it is the most accurate measure of data and conversion.  To this point, WikiPedia explains:

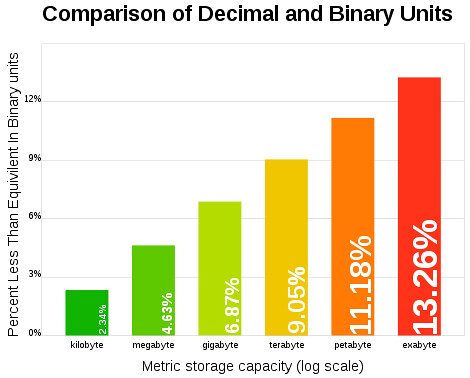
The relative difference between the values in the binary and decimal interpretations increases, when using the SI prefixes as the base, from 2.4% for kilo to over 20% for the yotta prefix.  This chart shows the growing percentage of the shortfall of decimal interpretations from binary interpretations of the unit prefixes plotted against the logarithm of storage size.

SnagIt Capture

However, Base 10 is much easier for the human brain to work with as the numbers are nice and round.  I believe this is how and why Base 10 became known as “Salesman Bytes” way back when.  I’ll be darned if I can find a reference to this term any longer in Google.

Long boring story short, this is a handy storage/network data conversion tool I still use from time to time today when working with large or varying numbers.  For those who don’t have a preferred tool for whatever use case, you’re welcomed to use the one I created.  A few notes:

  • Due to the extreme length of two of the formulas in the workbook, I had to upgrade it to Excel 2007 format at a minimum which is the reason for the file extension of .xlsx.
  • The data transfer section assumes the most optimal of conditions, no latency, etc.

Download network bandwidth transfer.xlsx (22.6KB)

Free VMware vSphere Client for iPad Available

March 18th, 2011 by jason No comments »

SnagIt CaptureIt has been an exciting couple of months for VMware in terms of product releases.  Now, VMware has done it again.  Effective immediately, the vSphere Client for iPad is announced and is generally available for download from the Apple App Store.  Leave your wallet and iTunes gift cards parked.  Similar to the VMware View Client for iPad, this app is also brought to the community free of charge.  From anywhere, we can now view key performance metrics and perform essential management tasks in a simplified and portable interface.

The new client is not meant to be functionally equivalent to the existing vSphere Client for Windows.  Rather, the idea is to be able to perform the most common vSphere administrator tasks.  This release is version 1.0.1.  As such, not all of the desired features and functionality is baked in.  Future development will be an iterative process from the GA release point forward. Feedback from end users will be collected and improvements will be built into future versions.  vMotion will perhaps be the most desired feature but unfortunately it did not make GA release.  VMware promises it will be the next feature added so that is more good news to look forward to on the horizon. 

Other potential wish list items which didn’t make the GA build are ESX Service Console, ESXi DCUI, and guest VM console access.  In my opinion, I wouldn’t look for console features any time soon.  I believe the spirit of the vSphere Client for iPad is to provide simplified management through an easy to use interface ala knobs and buttons.  Console access falls into that last 20% of advanced troubleshooting which extends beyond the intended use case of the iPad Client.

Architecture

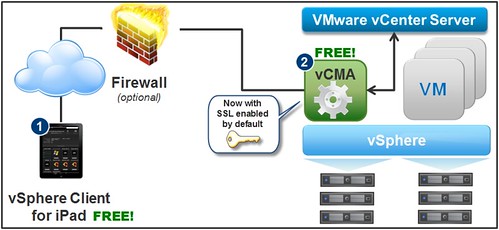
So what’s under the hood?  Let’s take a look.  Aside from the foundational vSphere infrastructure (which is available as a free 60-day evaluation), there are two components, both free, which enable the delivery of portable management bliss:  the vCMA and the client for iPad itself.  To connect with the client from a remote location via the internet, a VPN connection on the iPad placing it local on the destination network is required.  Like the View Client for iPad, the vSphere Client for iPad is developed for iPad only.  No iPhone, iOther, etc.  The logic is built into the vCMA which will make it extensible for Android in the future.  Additionally, the vCMA will eventually be retired and its functionality will be rolled natively into vCenter Server.  I like this idea because my lab is getting to be somewhat appliance heavy which limits capacity to run the traditional VMs I want to be testing with.  Following is a visual overview of the architecture:

SnagIt Capture

SnagIt Capture

As mentioned earlier, future development will be an iterative process based on customer feedback.  These discussions can be aired in the vSphere Client for iPad VMTN Community forums located at the URL below.  Do not be shy.  VMware WANTS your feedback:

http://communities.vmware.com/community/vmtn/vsphere/ipadclient

Now let’s take a bit of a deeper dive by looking at the installation process and the management capabilities of the app.

Installation and Configuration

  1. Download the vSphere Client for iPad application from the iTunes Store.
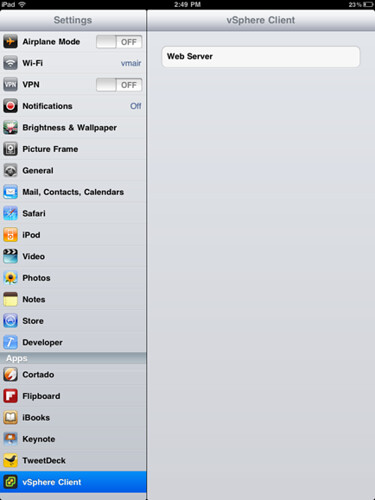
  2. Once the vCMA virtual appliance (available for free at http://labs.vmware.com/flings/vcma) powers on, on the home screen of the iPad go to “Settings”, scroll down and tap on “vSphere Client” (an example this screen is shown below).
  3. Enter the IP Address of the vCMA virtual appliance in the “Web Server” field (again, see the sample image below).
  4. Ensure your iPad has connectivity to the vCMA virtual appliance (note: as of this writing, the vCMA has SSL enabled by default). This may entail configuring the iPad’s built-in VPN client. Consult Apple’s documentation on configuring the built-in VPN client.
  5. Launch the vSphere Client for iPad application and enter the host, username and password for the vCenter Server or vSphere Host you wish to connect to.

SnagIt Capture

Management Capabilities

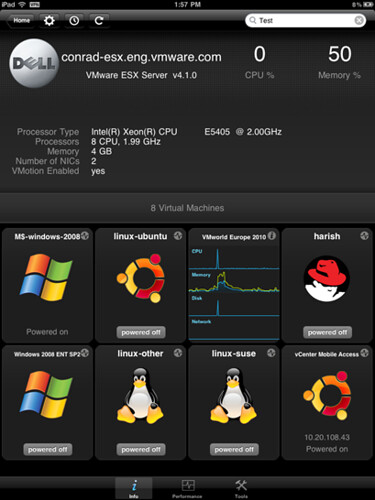
Search for vSphere hosts and virtual machines.�
Reboot vSphere hosts or put them into maintenance mode.

SnagIt Capture

Manage virtual machines with the ability to start, stop and suspend.�
View and restore virtual machines’ snapshots

SnagIt Capture

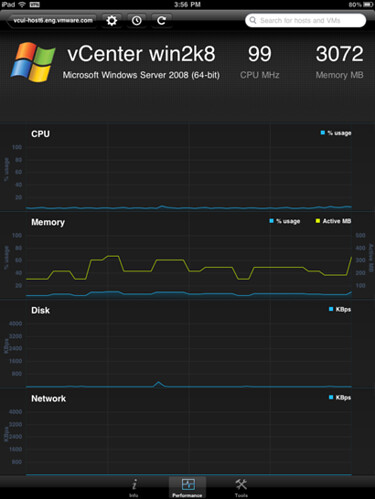
Monitor the performance of vSphere hosts and virtual machines:

SnagIt Capture

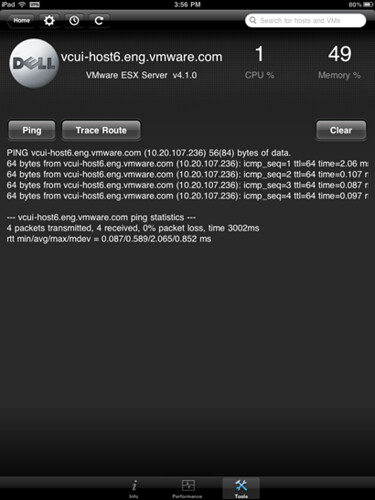
Diagnose vSphere hosts and virtual machines using built-in ping and traceroute tools:

SnagIt Capture

Videos

Following are a few short video clips which VMware has made available covering the vSphere Client for iPad.

Configure the vCMA Virtual Appliance:

httpv://www.youtube.com/watch?v=msjXKWFdgcM

Configure & use the iPad app:

httpv://www.youtube.com/watch?v=6kRalVLzMvE

Summary of the iPad development by VMware at VMworld in Copenhagen October 2010:

httpv://www.youtube.com/watch?v=UseseTSNOP0

VMware is sure to gain popularity by offering virtualization and cloud management tools for portable devices… and at the right price.  VMware is listening to feedback and has already reacted with a modified list price in this GA release.  I think last week’s launch of the View Client for iPad was a big hit.  It will be interesting to see how well received this app is, particularly by the *nix folks who have been patiently waiting their turn for some client development love.

Updated 3/20/11:  Srinivas Krishnamurti, Senior Director for Mobile Solutions at VMware, has written a piece on his blog over at the Office of the CTO.  Read it here: VMware vSphere Client for iPad has left the building…

VMware Talk Puzzler

March 15th, 2011 by jason No comments »

SnagIt Capture

I’ve been a fan of the Car Talk radio program since I was introduced to it in 1993.  I hope the Tappet brothers don’t mind if I borrow the theme from one of their popular segments appropriately called Puzzler.  It seemed fitting for this article which I’m going to call VMware Talk Puzzler.  Not surprising, the goal of the Car Talk Puzzler is to listen to the problem (which is typically not simple), then provide the root cause.  In this adaptation, I’ll present a real life vSphere problem.  If you choose to take a stab, your job is three fold:

1) Identify the root cause of the problem.

2) Identify the solution.

3) Identify the unique tasks or chain of events which lead to the problem.

Here we go.

I was called in to help troubleshoot a problem.  “Carl” had created a virtual machine in a VMware vSphere 4.1 Update 1 cluster.  The problem Carl was experiencing was that the VM would not power on.  Error messages in vCenter include but are not limited to:

  • “Failed to find a host for powering on the virtual machine.”
  • “The following faults explain why the registered host is not compatible.”
  • “The number of virtual CPUs may be limited by the guest OS selected for the virtual machine or by the licensing for the host.”

I asked if the ESXi cluster and vCenter were licensed.  Carl confirmed by showing me that vCenter was licensed with Standard Edition and the hosts which wouldn’t power on the VM were still using 60 day Evaluation licensing as they were just recently built.  I further verified the Evaluation licensing had not yet expired.

I asked Carl to show me details of the VM.  He proceeded to show me the VM was created with the following shell specifications:

  • Guest OS: Microsoft Windows Server 2008 (64-bit)
  • VM Version: 4
  • CPU: 8
  • Memory: 4096MB 


1) Identify the root cause of Carl’s vSphere problem.

2) Identify the solution for Carl.

3) Identify the tasks or chain of events which lead to Carl’s problem.

If you think you know the answer, write it on the top of a shrink wrapped pallet containing a Cisco UCS 5100 Series Blade Server Chassis, fully loaded with UCS B200 M2 Blade Servers each with 192GB RAM, UCS 6100 Series Fabric Interconnects, and a pair of Cisco Nexus 5548P next generation 10GbE switches and send to my mailing address.

Or… reply in the comments section below.

The first correct and complete answer (I hope there is just one) will receive internet recognition, real life respect, and if I can find one, a prize.  No promises on that last one but I’ll see what I can do.

VMware vSphere 4.1 HA and DRS technical deepdive review

March 14th, 2011 by jason No comments »

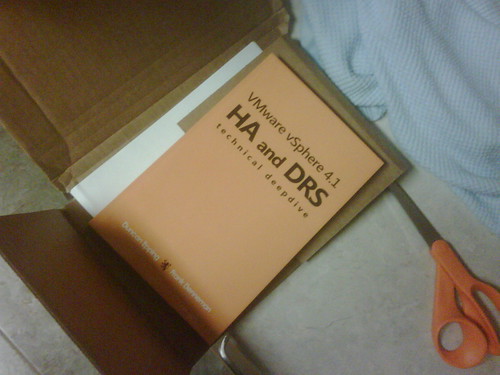
A few months ago, I wrote about the arrival of the new VMware vSphere 4.1 HA and DRS technical deepdive book.  Having finished reading the book, I thought I’d write a quick follow up.

This book was a pretty easy read, and by that I mean it as a compliment in that the authors did a superb job in conveying the details of deep technical discussions in a way that I think is easy to comprehend and understand at different levels.  At the same time, the coverage did not disappoint.  All aspects of HA, DRS, and even DPM were discussed at length.  Along the way, Basic Design Principles in each section were highlighted to summarize the technical detail.

Duncan and Frank cover not only the supported parameters, but the unsupported and sometimes undocumented tweaks as well.  Most important, they are very clear in pointing out what’s supported by VMware and what’s not.

I feel that I have a pretty good handle on HA and DRS but that doesn’t mean that time spent reading this book was wasted.  I picked up some design bits that I hadn’t thought about before having not been exposed to the environments in which they would apply.  Some sources do a fine job in discussion either HA or DRS, but what sets this book apart is that it expands into how the two operate together which is just about as important to understand as the individual topics themselves.  The DRS and DPM chapters exposed the computational math behind the decisions which DRS makes.  Quite honestly, I probably learned the most here.  Not that I’ll be able to keep the formulas in memory for very long, nonetheless the content and the size of the book will make it a great reference.

Capping the end of a great book I was pleasantly surprised to find an Appendix containing all of the Basic Design Principles, as well as all of the advanced parameters for HA and DRS.  If you’re short on time for reading, advanced to the 11 page Appendix in the back and you’ll get a pretty good summary of the first 18 chapters.

If you buy the book, I hope you enjoy it as much as I did.  Thanks Duncan and Frank!